martedì 14 febbraio 2006

Posterior pituitary ectopia


Findings

The posterior pituitary bright spot (Figure 2 and Figure 3) is ectopic, located just inferior and posterior to the tuber cinereum. The adenohypophysis is small. The pituitary stalk (Figure 2 and Figure 3) is hypoplastic and difficult to see.


Diagnosis: Posterior pituitary ectopia


Posterior pituitary ectopia is a developmental disorder of the porencephalon, thought to be genetic in origin. Multiple genes have been implicated. The end result is defective neuronal migration. Patients often have other midline abnormalities, such as septooptic dysplasia and lobar holoprosencephaly. Other structures developing at the same time may be affected. The optic/olfactory nerves and the anterior pituitary should be carefully evaluated, as they may be abnormal or absent. Additional associated syndromes include: Kallmann sydrome, CHARGE syndrome, and Pallister-Hall syndrome. Patients are imaged because of other abnormalities, hypopituitarism, and short stature. The anterior pituitary may be affected by absence or hypoplasia of the infundibulum.

Cranial computed tomography may reveal the pituitary fossa to be small. On MRI, the posterior pituitary bright spot (bright secondary to the accumulation of ADH-neurophysin) is ectopic and often seen just below the tuber cinereum. The ectopic pituitary is hyperintense on T1-weighted imaging. The adenohypophysis is small. On either CTA, conventional angiography, or MRA the supraclinoid carotid arteries approach the midline and appear to be “kissing.” The frontal lobes may be abnormal.

venerdì 10 febbraio 2006

Spinal involvment in Hodgkin's lymphoma


Findings

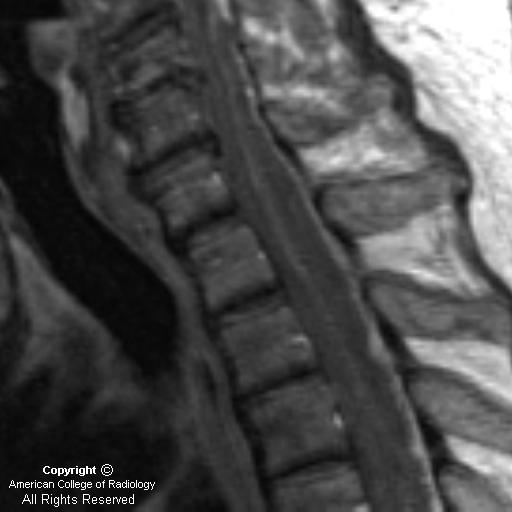
Sagittal T1 image (Figure 1) in a patient with Hodgkin's lymphoma. Compression deformity of the C4 vertebral body is noted and there is abnormal marrow signal. There is an associated mass with epidural extension of tumor that directly impinges on the cord, displacing intervening CSF.

Two sagittal T2 images (Figure 2 and Figure 3) in a patient with Hodgkin's lymphoma show compression deformity of the C4 vertebral body (Figure 2). There is an associated mass with epidural extension of tumor that directly impinges on the cord with additional tumor seen anterior to the vertebral body. Displacement of the intervening CSF is better demonstrated on this T2-weighted sequence (Figure 3).

Axial T2 image (Figure 4) at the affected level confirms that the anterior aspect of the cervical canal is flattened by the tumor with loss of intervening CSF and deformity of the cord. These findings are indicative of cord compression.


Diagnosis: Spinal involvment in Hodgkin's lymphoma


Acute spinal cord compression is a potentially devastating neurological emergency that requires both prompt diagnosis and intervention to prevent permanent impairment. The frequency of metastatic cord compression is increasing as cancer prevalence rises and new treatment modalities prolong patient survival. Approximately 5% of patients with terminal cancer develop epidural spinal cord compression. Metastases are 25 times more common than primary tumors as a causative etiology. Intramedullary spinal cord metastasis have frequency of 1/16 that for epidural metastasis and are best diagnosed by MRI. Of note, approximately 20% of cancer patients with spinal cord compression have the associated new neurological deficits as their initial manifestation of disease.

Many types of tumor metastasize to the epidural space. Relative incidence of spinal cord compression by a particular type of tumor is determined by a combination of tumor prevalence in the population and its predilection for spinal involvement. The most common tumors causing cord compression in adults are prostate, breast, lung, NHL, multiple myeloma, renal, and colorectal cancer. The most common types in children are germ cell tumors, Hodgkin's, and sarcomas, especially Ewing’s.

Magnetic resonance imaging is the study of choice in the evaluation of suspected cord compression as it is noninvasive, does not involve radiation, and provides for investigation of both osseous and soft tissue lesions. Whole spine imaging is generally undesirable as it is more time-consuming, expensive, and difficult for patients who are often in considerable pain. It further lowers resolution on exams that are often suboptimal secondary to severe patient pain and patient movement.

Therefore, information from the neurological exam is critical for localization of the lesion and optimization of the imaging protocol. Spinal sensory levels on neurological examination may be up to several segments below the anatomic level of cord compression. Evaluation of motor function and reflexes is very useful for lesion localization. Pain is ubiquitous in cancer patients, and while it may be initially localized, it is not specific to cord compression and is more often related to vertebral metastasis and pathologic fracture. Pain increases in intensity with worsening compression. Pain from cord compression often worsens with recumbency.

Once the site of interest is more precisely identified, sagittal T1 and T2 images and axial T2 images are required for the diagnosis. Spinal cord compression may be defined on imaging as the presence of a mass lesion abutting the cord with the complete loss of intervening CSF. This must be accompanied by deformation of the spinal cord or the presence of signal changes within the cord. The findings are best visualized on T2-weighted images. If the patient is concurrently symptomatic, acute intervention is mandated with the specific type of intervention determined by the underlying disease process.

martedì 7 febbraio 2006

Pars interarticularis stress fracture


Findings

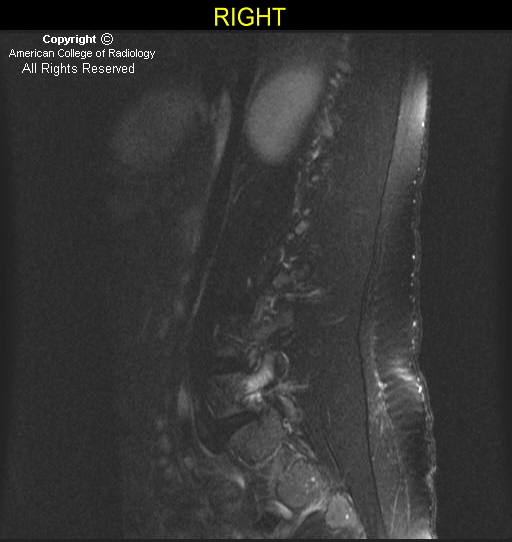
CT images demonstrate lucencies through the pars bilaterally (yellow arrows in Figure 4) involving the anterior and posterior cortical margins on the left (Figure 6) and anterior cortical margin on the right (Figure 5). The irregular margins suggest recent injury. There was no evidence of listhesis on sagittal reconstructions.
T2 fat saturated MR images demonstrate edema in the pars and pedicles bilaterally (Figure 7, Figure 8, and Figure 9).


Diagnosis: Pars interarticularis stress fracture


Asymptomatic spondylolysis and spondylolisthesis occur in 6%-8% of the general population and are often identified incidentally. A percentage of individuals who are genetically predisposed to developing these entities will become symptomatic with or without an inciting injury. A high prevalence among athletes who participate in activities that subject the lumbar spine to repetitive loading suggests that trauma is also an etiologic factor. Spondylolysis and spondylolisthesis involving the lumbar spine are the most frequently diagnosed organic causes of back pain in children and adolescents). The child or adolescent typically presents with low back pain occasionally radiating to the buttocks or posterior thigh. The pain is usually insidious in onset and progressively increases in severity. The diagnostic work varies widely by clinician.

PA and lateral radiographs of the lumbosacral spine are used as a screening evaluation and can assess overall spinal alignment. They may also identify focal sclerosis associated with stress reactions of the pars, lamina or pedicle, as well as defects of the pars. Single-photon emission computed tomography (SPECT) of the spine is indicated in the evaluation of patients with inconclusive radiographs but whose history and clinical examination suggest the presence of spondylolysis. Increased uptake in the pars, adjacent lamina, or pedicle - either unilateral or bilateral - suggests a stress reaction, stress fracture, or symptomatic spondylolytic defect. SPECT, however, may be positive in other etiologies, including neoplasm and acute fracture. A negative SPECT in the presence of a spondyloltic defect identified on radiographs is an incidental finding.

CT is often used to define the bone morphology of spondylolysis. Stress reaction is defined as localized sclerosis without trabecular or cortical disruption of the pars, lamina, or pedicle. Stress fracture is defined as cortical or trabecular disruption of the pars with minimal sclerosis or lysis of the fracture gap. Pars disruption with surrounding sclerosis and a definable area of lysis at the site of the pars discontinuity is diagnostic of a spondylolytic defect.

Although the overall role of MRI has yet to be determined, MRI may also be obtained to identify marrow edema at the pars or if neurologic symptoms are present. Stress injuries to the lumbar pars interarticularis initially manifest as bone marrow edema visible as abnormal high T2 signal on sagittal fat-saturated MR images. Signal abnormalities may also be seen in the adjacent pedicle and articular process. As the stress injury progresses, thinning, fragmentation, or irregularity of the pars interarticularis may become visible.

lunedì 6 febbraio 2006

Juvenile pilocytic astrocytoma


Findings

Figure 1: Noncontrast CT demonstrates a large midline posterior fossa solid and cystic mass with associated compression of the fourth ventricle.
Figure 2: Axial FLAIR demonstrates a solid nodule and a tumor cyst. Surrounding vasogenic edema is present.
Figure 3: Axial post-contrast T1 MR image demonstrates diffuse enhancement of the solid tumor nodule.
Figure 4: Sagittal post-contrast T1 image demonstrates cerebellar tonsillar herniation.


Diagnosis: Juvenile pilocytic astrocytoma


Primary brain tumors are the most common solid neoplasms in children, representing approximately 20% of all pediatric tumors. The posterior fossa is the most common location of primary brain tumors in children.

The most frequent posterior fossa tumors in children are juvenile pilocytic astrocytoma (JPA), medulloblastoma, ependymoma, and brainstem glioma. The JPA is second in frequency only to medulloblastoma.

Pilocytic astrocytomas usually present within the first two decades of life, with a peak age of presentation at 10 years. Patients present with headache, nausea, and vomiting, usually secondary to hydrocephalus, or may have symptoms because of brainstem or cerebellar compression.

When completely removed, there is a greater than 90% five-year survival rate. Surgery is usually curative, but prognosis does depend on cellular morphology.

The typical radiographic appearance is that of an enhancing mural nodule, as well as a nonenhancing cystic component. Most are well-defined and located off the midline in the cerebellar hemispheres or vermis. The nodular portion of the lesion usually demonstrates homogenous contrast enhancement. Calcification is uncommon. Twenty per cent are solid without cysts. MRS can demonstrate elevated choline, lactate, and myoinositol. Avid uptake is often present on PET scans.

lunedì 30 gennaio 2006

Post-traumatic fracture with cord compression


Findings

Two sagittal T2 images (Figure 1 and Figure 2) in a trauma patient. There is an acute compression fracture of the T11 vertebral body with retropulsion of the posterior cortex. There is loss of CSF signal between the posterior vertebral cortex and the spinal cord and there is deformity of the cord at the fracture site. Increased T2 signal is seen in the cord at this level.
Axial T1 image (Figure 3) demonstrates the fracture with associated cord compression, less well seen than on the T2 images. Abnormal signal adjacent to the cord is consistent with subacute hemorrhage.
Axial T2 image (Figure 4) confirms the fracture, loss of CSF between the cord and adjacent bone (Figure 4), and the two bright foci of signal abnormality within the cord. This increased T2 signal is seen within the central gray of the cord with sparing of the white matter tracts, a common initial presentation of cord edema. Additional bony disruption is seen on the left.


Diagnosis: Post-traumatic fracture with cord compression


Acute spinal cord compression is a potentially devastating neurological emergency that requires both prompt diagnosis and intervention to prevent permanent impairment. Close cooperation between clinical services and diagnostic radiologists is essential for patient triage. This is especially true in cases where patients cannot be fully examined neurologically. Magnetic resonance imaging is the study of choice in the evaluation of these patients, as it is noninvasive, does not involve radiation, and provides for investigation of both osseous and soft tissue lesions.

Information from the neurological exam is critical for localization of the lesion and optimization of the imaging protocol. Whole spine imaging is generally undesirable, as it is more time-consuming, expensive, and difficult for patients who are often in considerable pain. It further lowers resolution on exams that are often suboptimal secondary to severe patient pain and patient movement. Spinal sensory levels on neurological examination may be up to several segments below the anatomic level of cord compression. Evaluation of motor function and reflexes is very useful for lesion localization.

Once the site of interest is more precisely identified, sagittal T1 and T2 images and axial T2 images are required for the diagnosis. Axial T1 images through the lesion may then be obtained for further characterization of the anatomy and evaluation of hemorrhage. Intravenous contrast is not necessary for the diagnosis of acute cord compression.

Spinal cord compression may be defined as the presence of a mass lesion abutting the cord with the complete loss of intervening CSF. This must be accompanied by deformation of the spinal cord, or the presence of signal changes within the cord. The findings are best visualized on T2-weighted images. If the patient is concurrently symptomatic, acute intervention is mandated with the specific type of intervention determined by the underlying disease process. In acute cord compression secondary to trauma, imaging findings may also have prognostic value separate from findings on neurological exam.

martedì 24 gennaio 2006

Superior sagittal sinus thrombosis


Findings

Figure 1: Unenhanced head CT demonstrates prominent hyperdensity in the superior sagittal sinus. No parenchymal abnormalities are seen.
Figure 2: Sagittal T1 without contrast demonstrates abnormal hyperintensity within the superior sagittal sinus and the expected flow void is not seen.
Figure 3 and Figure 4: Contrast enhanced T1 images in the axial and coronal planes demonstrate abnormal hypointensity within the superior sagittal sinus surrounded by peripheral enhancement, the “empty delta” sign (Figure 3 and Figure 4). There is also uniform enhancement of the dural membranes.
Figure 5: Phase contrast MR venogram demonstrates no flow within the superior sagittal sinus. Flow is seen within the internal cerebral veins, the vein of Galen and the straight sinus.


Diagnosis: Superior sagittal sinus thrombosis


Superior sagittal sinus (SSS) thrombosis is an often underdiagnosed condition that can have serious neurologic sequelae. Thrombus occurring within the SSS and other intracranial venous structures may lead to cerebral venous infarction, hemorrhage, and hydrocephalus. Imaging characteristics of dural sinus thrombosis are key to its diagnosis as clinical symptoms are often variable and nonspecific. Common clinical signs and symptoms are headache, nausea, confusion, and lethargy.

Predisposing factors leading to SSS thrombosis may be grouped into one of three categories: hypercoagulable state, venous flow disturbance, and in association with infection or inflammation. However, up to one-quarter of cases are idiopathic. Hypercoagulable states may be congenital or acquired and include protein S deficiency, antithrombin III defeciency, oral contraceptive use, pregnancy, dehydration, and malignancy. Conditions in which there is disturbance of SSS flow include mass lesions and heart failure. Examples of infectious-inflammatory states predisposing to SSS thrombosis are sinusitis, mastoiditis, trauma, and sarcoidosis. The patient presented here was recently post partum, and a hypercoagulable state associated with her pregnancy was the most likely risk factor in the development of her SSS thrombosis.

On unenhanced CT, increased attenuation may be visualized within the SSS. The intracranial venous structures may appear prominent secondary to venous congestion. Contrast-enhanced CT and MR often demonstrate enhancement and/or enlargement of the venous structures. The “empty delta sign” may be present, which is likely caused by enhancing collateral channels in the dural membranes outlining a nonenhancing thrombus in the SSS. The sign is seen in only a minority of cases, but it is highly specific for SSS thrombosis. MR also may show lack of the expected flow void within the SSS, coupled with abnormal signal intensity within the SSS, suggesting the presence of thrombus. MR venography can show the lack of flow in the affected sinus. The MR venogram must be a phase contrast sequence as time-of-flight sequences can demonstrate hyperintense clot within the SSS that may be misinterpreted as patency. Secondary signs of the thrombus may also be present with T2- and diffusion-weighted abnormalities, venous congestion, hemorrhage, and hydrocephalus. SSS thrombosis is usually treated with anticoagulation. Most patients experience improvement, and many experience virtually complete recovery.


mercoledì 11 gennaio 2006

Spinal epidural abscess


Findings

Sagittal T1 (Figure 1): There is an isointense posterior epidural mass that extends inferiorly from the C4-C5 disc space level and displaces the spinal cord anteriorly.
Sagittal T2 (Figure 2): The posterior epidural high-signal mass is more well-defined on this T2-weighted image.
Axial T2 (Figure 3): Image demonstrates compression of cord elements by the posterior epidural mass.
Post-contrast Sagittal T1 (Figure 4): Image demonstrates an enhancing posterior epidural collection consistent with an abscess.


Diagnosis: Spinal epidural abscess


A spinal epidural abscess (SEA) can present with nonspecific signs and symptoms, including lower back pain, lower extremity weakness, or even sepsis. Cord compression can result if an epidural abscess in the spinal canal is not promptly treated. In a patient with back pain and fever, an SEA should be considered until proven otherwise.

An SEA can result through hematogenous spread or from direct extention of adjacent discitis or osteomyelitis. Remote infections, from indwelling catheters or even urinary tract infections, may hematogenously spread to create an SEA. Alternatively, any procedure in which there is direct puncture into the spinal canal, may seed an infection that leads to the development of an epidural abscess. Additional risk factors for the development of SEA include IV drug abuse, diabetes, alcoholism, and chronic immunosuppression.

MRI with gadolinium is the test of choice in evaluating patients suspected of having an epidural abscess. Alternatively, CT myelography can be utilized in patients who have contraindications to MRI. A lumbar puncture is a relative contraindication if a spinal epidural abscess is suspected, because infectious agents may be introduced into the subarachnoid space.

MRI findings usually fall into 2 categories: 1) A soft tissue mass that is hypointense on T1-weighted images and hyperintense on T2-weighted images with diffuse homogeneous or slightly heterogeneous enhancement within the collection; 2) As the phlegmonous mass necroses, there may be a peripherally-enhancing fluid collection. Spinal epidural abscesses may be located anteriorly or posteriorly within the spinal canal. Anterior epidural abscesses are generally secondary to spread of adjacent infection from discitis or osteomyelitis. Posterior epidural abscesses may occur as a result of hematogenous spread of remote infections. Other causes of back pain that should be considered in the differential diagnosis include herniated disc, neoplasm, spinal hematoma, and transverse myelitis.

Those patients who do not present with neurological symptoms may be treated with medical therapy alone. Those with neurological compromise are treated with surgical decompression and antibiotics. Our patient underwent successful surgical decompression of his spinal epidural abscess.