Visualizzazione post con etichetta Signs. Mostra tutti i post

martedì 24 agosto 2010

Non-hemorrhagic pituitary apoplexy


Findings

A mixed signal (mildly hyper intense on T1-weighted and mixed hyper/hypo intense on T2 weighted sequences) lobular mass with thin rim-enhancement arises from the sella, extending superiorly above the diaphragm sellae (“snowman sign”), deviating the optic chiasm upwards. There is no diffusion restriction, and no susceptibility artifact (on B0 DWI sequences) to suggest hemorrhage. The clivus, and bony sella are intact. A thick rim of dural enhancement dorsal to the clivus is noted.


Diagnosis: Non-hemorrhagic pituitary apoplexy (with underlying macroadenoma)


Key points


Pituitary apoplexy (PA) (e.g. "necrosis") refers to hemorrhage or infarction of the pituitary.
Commonly there is a pre-existing macroadenoma (65-90%).
Acute clinical syndrome includes HA, visual defects/ophthalmoplegia, AMS, and variable endocrine deficiencies.
Acute imaging features show enlarged gland (T1/T2 isointense) with peripheral enhancement, with or without hemorrhage.
Subacutely – gland T1/T2 hyper intense, and chronically – appears as "empty sella" (filled with CSF) with T1 hypo / T2 hyper signal
T2*GRE sequence is very sensitive in looking for hemorrhagic products.
Sometimes there is subarachnoid hemorrhage.
Thickening/enhancement of adjacent dura (50%) and sphenoid mucosa (80%)
Differential diagnosis includes: Pituitary macroadenoma (non-hemorrhagic), craniopharyngioma, Rathke's cleft cyst, pituitary abscess, primary intrapituitary hemorrhage, or giant thrombosed intrasellar aneurysm.
Patients often suffer from long-term pituitary hormonal insufficiency.
Treatment of PA includes: Steroids, fluid/electrolyte replacement, and sometimes surgical decompression.


Discussion of disease

Pituitary adenomas are benign, slow-growing tumors which arise from the adenohypophysis, classified as either micro (< 10mm, 40 %) or macro (> 10 mm, 60%). However, occasionally leptomeningeal metastases can be seen. Patients present with indolent onset of headache, bitemporal hemianopsia (from optic chiasm compression), endocrinologic symptoms.

Pituitary apoplexy (PA), or pituitary necrosis, is usually caused by hemorrhage or infarction of the gland. There can, however, be bland necrosis (without either). The clinical syndrome is of somewhat acute onset with headache, visual defects/ophthalmoplegia, altered mental status, and variable endocrine deficiencies. Pre-existing macroadenoma is very common (65-90%). There is often associated subarachnoid hemorrhage. Thickening / enhancement of the adjacent dura and sphenoid sinus mucosa is very common. Sheehan’s syndrome is a rare peri-partum or post-partum (can be up to 15-20 yrs after index pregnancy) infarction of the pituitary with loss of anterior pituitary hormonal function. Long-term pituitary insufficiency is very common after PA. Treatment may include steroids, fluid/electrolyte replacement, or even surgical decompression.


Radiologic overview

CT (macroadenoma) – isodense to grey matter; fill and expand the sella turcica. CT is excellent for evaluating for sphenoid sinus invasion / bony destruction. Hemorrhage 10%, rarely calcify; pituitary apoplexy appears as hyper dense (acute), or as an "empty sella" if chronic, and very characteristic rim-enhancement.

MR – sellar mass without separate identifiable gland (mass is the gland) with "figure of 8" or "snowman" configuration (coronal), from constriction is caused by diaphragma sellae. Pituitary apoplexy has similar findings, with signal changes based presence/age of hemorrhage. Chronic PA will appear as an "empty sella" (T1 hypo, T2 hyper = filled with CSF). There is thickening / enhancement of adjacent dura in 50% of cases (seen in the presented case), and thickening / enhancement of sphenoid sinus mucosa 80% of the time.


giovedì 19 agosto 2010

Joubert syndrome


Findings

There is agenesis of the vermis. The interpeduncular fossa is deep. There is a cerebellar cleft. There is prominence and thickening of the superior cerebellar peduncle. There is a bat wing configuration of the fourth ventricle.


Diagnosis: Joubert syndrome


Key points

Joubert syndrome is an autosomal recessive genetic disorder that affects the cerebellum and midbrain. There is agenesis/hypogenesis of the cerebellar vermis and malformation of the midbrain and brainstem.

With poor development of the cerebellar vermis and brainstem, patients can present with ataxia, hypotonia, and hyperpnea. One of the first clinical signs of Joubert is episodic hyperpnea or apnea in an infant. Breathing can reach upwards of 160 breaths/minute. Mild mental retardation is often seen, though some may have normal intelligence. Patient health and growth are usually not affected. Patients with Joubert benefit from physical, occupational, and speech therapy. Infants with respiratory abnormalities require respiratory monitoring.


Radiologic overview of the diagnosis

The initial radiologic manifestations are often seen on fetal ultrasound with increased nuchal lucency being the most apparent finding. Fetal or Brain MR is the best modality to evaluate the presence of Joubert syndrome.

The classic findings are a hypoplastic/aplastic vermis, thick superior cerebellar peduncles, a deep interpeduncular fossa, and an abnormal midbrain. This configuration resembles a molar tooth and is often referred to as the "molar tooth" sign. The fourth ventricle also takes on a bat wing configuration. The midbrain is usually decreased in AP dimension. In this case, there is complete agenesis of the vermis and the molar tooth sign can be seen with thickening of the superior cerebellar peduncles. The corpus callosum and pars intermedia is thickened and may reflect a compensatory response by the brain adapting to the lack of a vermis.


mercoledì 16 dicembre 2009

Multiple cavernous malformations (AKA cavernomas) with associated large hemispheric developmental venous anomaly (AKA DVA or venous angioma)


Findings

CT head: Multiple areas of intracranial hemorrhage in the left hemisphere. There is thrombosis of the superior sagittal sinus and a left cortical vein. Two focal hyper dense masses are seen in the left occipital lobe and the medial left temporal lobe.
MRI and MRV brain: Multiple intraaxial masses in the left cerebral hemisphere seen in the temporal lobe, basal ganglia, occipital lobe, and genu of the corpus callosum which show blooming artifact on gradient echo images, and a hypo intense rim on T2-weighted images. There is a large left hemispheric venous angioma with dilated medullary veins which drain to the internal cerebral vein best seen on post contrast images. The anterior superior sagittal sinus is hypoplastic or stenotic.
Cerebral angiogram: No evidence of aneurysm or AVM. There is a large left venous angioma draining the entire left hemisphere into the internal cerebral vein then to the vein of Galen. Left cortical vein thrombosis, nonocclusive posterior superior sagittal sinus thrombus, and absence of the anterior superior sagittal sinus.

Differential diagnosis:
- Multiple arteriovenous malformations
- Multiple cavernous malformations with large venous angioma and sagittal sinus stenosis and partial thrombosis
- Multiple cavernous malformations with venous stasis due to sinus stenosis and partial thrombosis
- Multiple hemorrhagic metastases with leptomeningeal enhancement
- Multiple calcified metastases and leptomeningeal enhancement
- Sturge Weber with arteriovenous malformations


Diagnosis: Multiple cavernous malformations (AKA cavernomas) with associated large hemispheric developmental venous anomaly (AKA DVA or venous angioma)


Key points

The diagnosis is favored over cavernomas with venous stasis because:
- There is a known association between cavernous malformations and developmental venous anomalies.
- The cerebral angiogram shows an embryologic drainage pattern.


Cavernous malformations

Clinical
- Presentation: Seizure 50%, neurologic deficit 25%
- Pathology: Collection of endothelial lined, blood filled vessels without intervening normal brain
- Genetics: Multiple cavernous malformations can be seen with an autosomal dominant chromosomal abnormality
- Prevalence: 0.5%
- 75% solitary, sporadic lesion
- 10-30% multiple, familial
- Hemorrhage rate: Sporadic 0.25-0.75%

- Associated anomalies:
Developmental venous anomaly
Superficial siderosis
Cutaneous findings: café au lait spots, cherry angiomas

Imaging:
- Cerebral angiography: Most common angiographically occult vascular malformation, i.e. not detectable. May be associated with a venous angioma
- MRI: Popcorn ball appearance; mixed signal intensity core with a hypo intense hemosiderin rim; prominent susceptibility artifact ("blooming"). Diffusion usually normal
- CT: Negative in 30-50%; may appear as an ovoid hyper dense lesion. 40-60% have Ca2+


Developmental venous anomaly (AKA venous angioma)

Clinical
- Embryology: Felt to be secondary to arrested medullary vein development resulting in persistence of large primitive deep embryonic white matter veins
- Most common vascular malformation at autopsy
- Usually asymptomatic
- 15-20% associated with cavernous malformations
- Radially oriented dilated medullary veins
- Hemorrhage risk increases with occlusion of the draining vein. Risk felt to be 0.15% per lesion/year
- Multiple can occur with blue rubber-bleb nevus syndrome

Imaging
- Prevalence: 2.5-9% of MRI scans
- Contain normal intervening brain
- Dilated medullary veins have the "medusa head" or umbrella-like appearance; located often at the angle of the ventricle; stellate, tubular vessels converse on a collector vein which drains into a dural sinus/ependymal vein
- Differential diagnosis includes dural sinus occlusion with venous stasis and collateral drainage.
- Cerebral angiography: Most common angiographically occult vascular malformation, i.e. not detectable; may be associated with a venous anomaly
- MRI:
T1 and T2 weighted images: Can be normal if small, or see flow void if large enough
T1+C: Stellate pattern of tubular vessels of strong enhancement draining to a collector vein to a dural sinus/ependymal vein
MRV: Demonstrates medusa head and drainage pattern
CT: Usually normal. Parenchymal hemorrhage if draining vein occluded


martedì 21 luglio 2009

Subacute combined degeneration


Findings

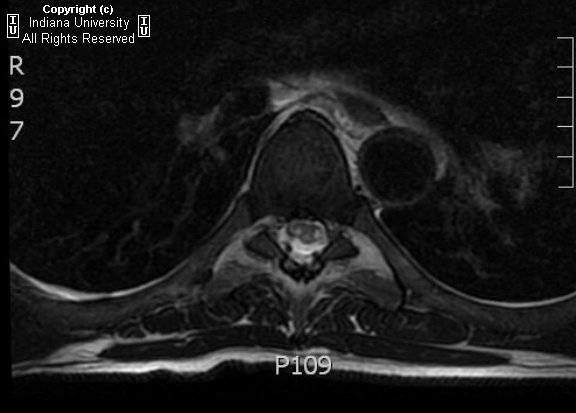
MRI of the thoracic and cervical spine show increased T2 signal within the posterior columns and the lateral corticospinal tracts on axial imaging. On sagital imaging, a longitudinal T2 signal abnormality is noted within the dorsal cord. There was no significant contrast enhancement status post gadolinium administration.

Differential diagnosis:
- Subacute combined demyelination
- Multiple sclerosis
- Astrocytoma
- Spinal cord infarction
- Infectious myelitis


Diagnosis: Subacute combined degeneration.


Vitamin B12 deficiency is the result of a malabsorption syndrome and can affect the brain, optic nerves, peripheral nerves and spinal cord. When patients present with myelopathy, such as sensory disturbances, weakness, and spasticity, it is known as subacute combined degeneration (SCD).

Clinical presentation of SCD is caused by dorsal column, lateral corticospinal tract, and sometimes lateral spinothalamic tract dysfunction. Patients initially present with paresthesia in the hands and feet, which can progress to sensory loss, gait ataxia, and distal weakness particularly within the legs. If the disease goes untreated, ataxic paraplegia may evolve. On physical exam, there is a loss of vibratory and joint position sense, weakness, spasticity, hyperreflexia, and extensor plantar responses. The diagnosis of B12 deficiency is made by serologic studies showing low serum B12 level; if the B12 level is borderline, elevated levels of homocysteine and methylmalonic acid help cinch the diagnosis.


Neuroradiology

Radiologic manifestations of SCD may be seen on MRI imaging, primarily within the cervical and thoracic spine, and include the following spinal manifestations:
- Mild spinal cord expansion and hypointensity on T1 weighted imaging.
- Increased T2 signal intensity primarily within the dorsal columns +/- lateral columns.
- Longitudinal dorsal cord T2 signal abnormality.
- Inverted "V" or "rabbit ears" T2 signal intensity within the dorsal spinal cord on axial imaging.
- Possible mild dorsal column contrast enhancement, with enhancement signifying breakdown of the blood nerve barrier.


Differential considerations

Although these MRI findings are consistent with SCD, they are nonspecific and include a broad differential diagnosis: demyelinating disorders, infectious etiologies, inflammatory conditions, ischemia, contusion, and neoplasms. However, SCD can be distinguished from other differentials given its bilateral nature of T2 signal abnormality over multiple levels that is confined to specific white matter spinal tracts. There can be partial to full reversal of MRI abnormalities following B12 therapy, with fifty percent of patients fully recovering and with the greatest recovery occurring when treatment is began in the early stages of the disease.

Multiple sclerosis is a demyelinating disorder with multiple lesions separated in time and space. MRI spine findings included increased T2 signal intensity and hypo or isointense T1 signal within lesions. These lesions, however, are more focal and well-circumscribed in nature compared to the contiguous lesions of SCD and show homogenous, nodular, ring enhancement of acute and subacute lesions status post contrast administration. Multiple sclerosis lesions rarely spans more than one or two vertebral segments and are usually not symmetric in nature.

Astrocytoma of the spine is an intramedullary glioma, more often located in the cervical than thoracic spine. This lesion presents as a hyperintensity on proton density and T2 weighted imaging, and almost always enhances. On T1 imaging, there is cord expansion, usually less than four segments. Again this is distinguished from SCD by location (intramedullary T2 signal intensity versus dorsal and lateral columns) and contiguity (SCD is contiguous over multiple vertebral segments).

Spinal cord infarction causes permanent tissue loss in the spinal cord secondary to vessel occlusion and usually presents hyper acutely. On MRI imaging, focal T2 hyperintensities can be seen in the gray matter, gray matter with adjacent white matter, or an entire cross section of the cord. These lesions are usually within the thoracic cord as it is an arterial border zone. T2 hyperintensities may also bee visualized within the anterior vertebral body bone marrow or deep medullary portion near the endplate secondary to vertebral body infarction. Diffusion weighted imaging shows restricted diffusion in the affected areas of the cord. Slight cord expansion and decreased signal is noted on T1 imaging. The MRI lesion distribution, bony involvement and diffusion changes differentiate spinal cord infarction from SCD.

Infectious myelitis can be secondary to HIV vacuolar myelopathy, varicella-zoster/herpes, or Lyme disease. On T1 imaging, there is cord expansion that nearly fills the spinal canal and variable, nonfocal enhancement status post contract administration. On T2 imaging, there is diffuse increased signal intensity throughout the involved segment, secondary to a swollen edematous cord. Unlike SCD, the signal abnormalities are not limited to the spinal tracts. However, MRI imaging findings may be identical to B12 deficiency and in such cases, can be distinguished by clinical presentation and laboratory findings.


venerdì 10 aprile 2009

Hallervorden Spatz disease


Findings

Figure 1 : Axial T2 weighted image at the level of the deep gray nuclei demonstrates the classic “eye of the tiger” sign, with T2 prolongation in the medial globi pallidi and hypointensity in the peripheral aspect of the globi pallidi.
Figure 2: Axial SPGR image at the same level demonstrates hypointensity in the globi pallidi as a result of the susceptibility effect from iron deposition.


Diagnosis: Hallervorden Spatz disease


Hallervorden Spatz disease is a rare neurodegenerative condition whose exact pathogenesis is unknown. Abnormal accumulation of iron in the brain, specifically in the globus pallidus and substantia nigra, is felt to play a predominant role in the neurodegeneration caused by the disease. A mutation in the pantothenate kinase gene leads to enzyme deficiency and subsequent accumulation of cysteine and iron chelates. The excess iron is deposited in the basal ganglia and damages neuronal structures.

Symptoms begin early in life, typically in early adolescence, and include extrapyramidal and gait abnormalities. Slow movements, rigid extremities, dystonia, tremors and speech abnormalities are typical findings. No cure exists, and therapy is aimed toward neurological symptoms. The typical clinical course is that of rapid progression, with death in early adulthood in most cases.

Imaging findings are usually classic, and typically described as the “eye-of-the-tiger sign”. This results from symmetric T2 prolongation in the globi pallidi with peripheral hypointensity and hypointensity in the substantia nigra. There is no associated enhancement of the areas of abnormal signal. The neural damage from abnormal iron accumulation results in diminished NAA on spectroscopy. The areas of iron deposition would be more conspicuous on susceptibility weighted images. In cases where the classic history and imaging findings do not lead to the diagnosis, other pathologies that preferentially involve the globi pallidi should be considered. These include metabolic derangements such as methylmalonic acidemia, Kearns-Sayre syndrome, Canavan disease and toxic and ischemic encephalopathies caused by anoxia, carbon monoxide and cyanide poisoning.


martedì 24 marzo 2009

Gas producing otogenic brain abscess with cerebral edema and pseudosubarachnoid hemorrhage sign


Findings

Figure 1: Soft tissue windows demonstrate generalized cerebral edema with loss of grey-white differentiation and near total obliteration of the CSF spaces. An ill-defined hypodense gas containing region is present within the left temporal lobe consistent with abscess formation. The subarachnoid spaces are hyperdense especially in the suprasellar region representing pseudosubarchnoid hemorrhage associated with cerebral edema and/or pyogenic leptomeningitis, not true hemorrhage.
Figure 2: Nondependently layering air is present within the anterior horn of the left lateral ventricle indicating communication between the left temporal lobe abscess and the left lateral ventricle and CSF spaces. On soft tissue windows, normal subcutaneous fat is seen confirming that this is intraventricular air, not fat.
Figure 3 and Figure 4: Bone windows demonstrate total opacification of the middle ear cavity and mastoid air cells consistent with otitis media and mastoiditis. There is subtle bony sclerosis and remodeling which along with the patient’s history is consistent with chronic otitis media with mastoiditis. Also note that there is no evidence of fracture to suggest penetrating trauma as an etiology for these findings. Bone window confirms the presence of air, not fat, in the frontal horn of the right lateral ventricle.


Diagnosis: Gas producing otogenic brain abscess with cerebral edema and pseudosubarachnoid hemorrhage sign


Complications of chronic supurative otitis media include (in order of decreasing frequency):
- mastoid abscess
- meningitis
- postauricular fistula
- lateral dural venous sinus thrombosis
- facial palsy
- cerebellar abscess
- Bezold’s abscess (involving sternocleidomastoid muscle)
- internal jugular vein thrombosis
- epidural abscess
- perisinus abscess
- Gradenigo’s syndrome (due to petrous apicitis)
- interhemispheric abscess
- temporal lobe abscess
- subdural abscess
- serous labyrinthitis
- Luc’s abscess (subperiosteal temporal bone without mastoiditis)

Otitic meningitis is the most common intracranial complication and can occur as a result of direct disease extension from the mastoid through a cortical defect or due to retrograde thrombophlebitis despite an intact appearance of the bone. Otogenic brain abscesses usually occur in the temporal lobe and cerebellum (2:1). Nearly all otogenic brain abscesses have underlying chronic suppurative otorrhea. More than half of all otogenic brain abscesses have an associated cholesteatoma.

Although the relative incidence of complications related to chronic otitis media is debated within the literature, many authors agree that the most dangerous complication is intracranial abscess formation which carries a 40-50% mortality rate. According to Nunez et al, 1.5 % of adults have active chronic otitis media and in an adult with active chronic otitis media, the annual risk of developing an intracranial abscess is about 1:10,000 with a male to female risk ratio of approximately 3:1. Though at first glance this risk appears relatively low, the lifetime expectancy of a 30 year old person with active chronic otitis media developing an abscess is 1:200. Intracranial complications in patients with active chronic otitis media are also more prevalent in adolescents and young adults.

Radiologic evaluation of a patient suspected of having intracranial complications related to active chronic otitis media is crucial to diagnosis and management. Axial CT with contrast is the usual modality of choice preferably with thin cuts, which can demonstrate the presence or absence of an abscess as well as details regarding its size and location. An intraparenchymal mass may show parenchymal low density with mass effect with or without an enhancing capsule. CT may be limited in the setting of acute infections. MRI may improve diagnostic accuracy, with increased sensitivity and specificity.

Etiologic agents usually include anaerobes, Proteus mirabilis, Pseudomonas aeruginosa, Streptococcus, and Staphylococcus. Anaerobic and gram negative bacteria appear to be the most common causes. Consequently, in addition to surgical management, initial treatment should include broad spectrum antibiotics with good cerebrospinal fluid penetration as well as anaerobic coverage. A team approach including an otolaryngologist, radiologist, anesthesiologist, and an infectious disease specialist among others is recommended for optimal outcome.


Pseudosubarachnoid Hemorrhage Sign


A pseudosubarachnoid hemorrhage sign is an unusual neuroradiologic finding which may be present in cases of diffuse cerebral edema and/or pyogenic leptomeningitis. In addition to increased attenuation of the otherwise normal subarachnoid spaces, the falx and tentorium can also appear dense. The etiology of this presentation is unknown. Current theories include: 1) blood-brain-barrier breakdown from microorganism toxins in pyogenic meningitis allowing leakage of dense proteinaceous material into the subarachnoid spaces; 2) cerebral edema causes displacement of CSF from the subarachnoid spaces with engorgement of the superficial pial structures creating a predominantly vascular space with relatively dense intravascular blood. Since management of the causes of subarachnoid and pseudosubarachnoid hemorrhage is quite different, it is important to be able to recognize this relatively rare sentinel neuroradiologic sign.

lunedì 26 gennaio 2009

Brain death from meningitis secondary to ear infection


Findings

Initital head / temporal CT: Pneumocephalus along the left falx of unknown etiology. No evidence of intracranial lesion, midline shift, or intracranial hemorrhage. No fracture of the temporal bones. Widening of the left lambdoid suture with well corticated borders, inconsistent with fracture. Fluid is present in the mastoid air cells bilaterally.

Follow-up CT: Unchanged pneumocephalus. Loss of the suprasellar and quadrigeminal plate cisterns consistent with herniation. Decreasing differentiation between the gray and white matter consistent with edema. Fluid again was seen in the mastoid air cells bilaterally.

Nuclear medicine study: No evidence of flow/perfusion to brain either on the early dynamic images or on the delayed images.

Differential diagnosis:
- Skull fracture
- Meningitis

Epilogue: Patient's girlfriend reported he was diagnosed with an ear infection, but did not fill the prescription. After toxicology consult, possiblity of meningitis was raised. While still in ER the second head CT was done which showed changes of diffuse brain hypoxia with cerebral edema and herniation. Examination at this point revealed fixed and dilated pupils with no brainstem reflexes. ICP monitor was placed showing pressure was significantly elevated, unable to be controlled with hyperosmolar therapy. A nuclear medicine scan was obtained and showed no evidence of flow or perfusion to the brain, findings consistent with brain death when taken in correlation with clinical findings.


Diagnosis: Brain death from meningitis secondary to ear infection


Key points

Differential diagnosis of Pneumocephalus
- Traumatic 74%
May be found within any compartment from skull, skull base, paranasal sinus, or mastoid fracture
3% of all skull fractures
8% of all paranasal sinus fractures
- Neoplasm involving sinus 13%
Osteoma, pituitary adenoma, mucocele, epidermoid, paranasal sinus malignancy
- Iatrogenic 4%
Lumbar puncture, craniotomy, craniectomy, ventriculostomy, ICP monitor placement
- Infectious 9%
Rare sequela of gas-producing infection
Typically sinusitis or mastoiditis
- Regardless, pneumocephalus itself is not a problem—what's causing it?

Epidural
- Remains localized
- Air will not necessarily move with changes in head position

Subdural
- Air-fluid levels
- Moves with changes in head position
- Confluent
- Tension pneumocephalus may result in "Mount Fuji sign"—subdural air separates/compresses frontal lobes, creating widened interhemispheric space between frontal lobe tips—mimics silhouette of Mt Fuji.

Subarachnoid
- Multifocal
- Non-confluent

CT: Imaging tool of choice
MRI: Foci of absent signal on all sequences


martedì 2 dicembre 2008

Occlusive atherosclerosis of the internal carotid artery (ICA) and secondary angiographic string sign


Findings

Figure 1: The left proximal common carotid artery demonstrates an atypical high-grade waveform, and a high resistance systolic upstroke. This waveform is more characteristic of the external carotid artery, and less like the internal carotid artery.
Figure 2: There is complete absence of flow in the left ICA and the ICA on grayscale appears completely occluded.
Figure 3 and Figure 4: Lateral views show the angiographic string sign. Early arterial phase images demonstrate a 99% stenosis of the proximal ICA. A trickle of contrast material is seen in the ICA distal to the stenosis.

Differential diagnoses
- String sign secondary to atherosclerosis at the proximal ICA and distal collapse of the ICA
- Dissection of the ICA
- Subacute/chronic thrombosis of the ICA
- Carotid artery stenosis secondary to radiation


Diagnosis: Occlusive atherosclerosis of the internal carotid artery (ICA) and secondary angiographic string sign


Atherosclerosis is the most common cause of the angiographic string sign. As the plaque enlarges, the pressure threshold for continued antegrade flow distal to the stenosis is reached. The distal ICA vessel lumen collapses as a result of decreased flow leading to the production of the string sign.

Carotid duplex ultrasound with color Doppler flow imaging and CT are first line diagnostic modalities for patients with symptomatic atherosclerotic vascular disease. When an occlusion of the carotid artery is seen, confirmatory imaging may be requested because differentiation between partial occlusion and a complete occlusion has important therapeutic implications.

The North American Symptomatic Carotid Endarterectomy Trial (NASCET) demonstrated a significantly decreased risk of stroke in patients with at least 70% stensoses, undergoing endarterectomy versus medical management (9% vs. 26%, respectively).

mercoledì 26 novembre 2008

Meningioma


Findings

CT shows a large circumscribed vertex mass in the right parietal region with heterogeneous hyperdensity and calcification. There is significant vasogenic edema and minimal if any mass effect or midline shift.
MRI from next day shows broad attachment of the lesion to the dura with moderate contrast enhancement. T2 prolongation compatible with vasogenic edema is again present.

Differential diagnosis:
- Meningioma
- Metastatic disease with hemorrhage and/or calcification
- GBM
- Low grade astrocytoma
- Angiosarcoma
- Tuberculoma


Diagnosis: Meningioma


Discussion

Meningiomas are thought to arise from arachnoid cap cells and may arise in the spinal cord or intracranially. Fewer than 10% are symptomatic. They may present with headache, seizure, or focal neurologic signs due to cranial nerve or brain parenchymal compression or vascular compression. Known causes include radiation and genetic abnormalities (including a relationship to NF2). Other causes are speculated as well. Meningiomas are generally considered benign tumors. However, a few histologic types can break this rule and invade cortex and even metastasize. Therapy includes conventional surgery and radiosurgery. Chemotherapy can be used following resection. Angiography is often performed for surgical planning and occasional embolization.


Radiologic overview of the diagnosis

Plain films of the skull may demonstrate hyperostosis and increased vascular markings. CT and MRI demonstrate extra axial, dural based lesions. Meningiomas typically enhance homogeneously and may have an enhancing dural tail (which may be more evident on coronal or sagittal MRI depending on the location)..On CT, the lesion may be isoattenuating to hyper attenuating but may contain calcifications. Vasogenic edema will likely be present and may be more apparent on MRI. T1 and T2 signal is variable. MR spectroscopy demonstrates a high alanine peak. Buckling of the cortex (seen in this case) is strongly suggestive of an extra axial lesion and should narrow the differential diagnosis. Other clues to extra axial location are brain cysts and trapped CSF. Angiographic findings include a sunburst vascular pattern and "mother-in-law" blush (comes early and stays late).


mercoledì 12 novembre 2008

Acute left MCA stroke with thrombus seen on CT-angiogram


Findings

Non-contrast head CT shows a left MCA stroke with a hyper dense linear structure in the left MCA. Angiogram confirms suspicion of thrombus in the left MCA.


Diagnosis: Acute left MCA stroke with thrombus seen on CT-angiogram


Key points

On MRI: Diffusion restriction with correlation on ADC map is diagnostic.
Seen as a hypo attenuating lesion on non-contrast Head CT.
Head CT can have false negative for acute stroke.
The hyperdense MCA sign implies acute thrombus and is a poor prognostic indicator.